This is a model response to a Writing Task 1 topic from High Scorer’s Choice IELTS Practice Tests book series (reprinted with permission). This answer is close to IELTS Band 9.
Set 4 Academic book, Practice Test 16
Writing Task 1
You should spend about 20 minutes on this task.
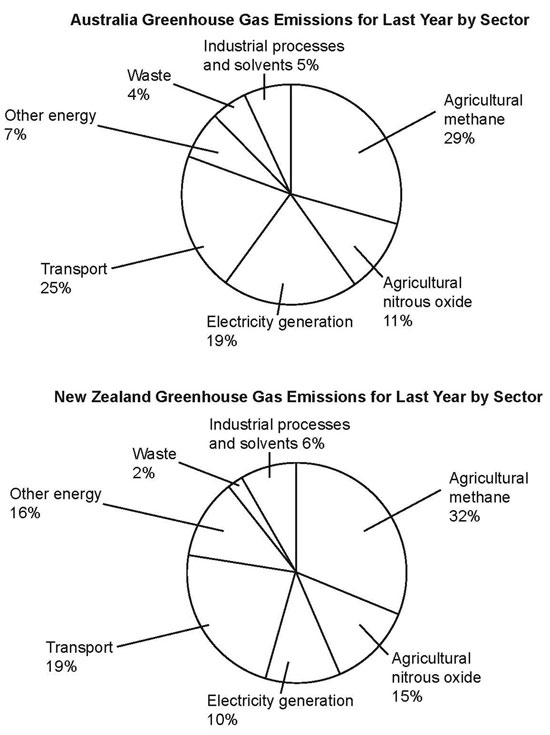
The pie charts below show the greenhouse gas emissions for last year by sector for Australia and New Zealand.
Summarise the information by selecting and reporting the main features, and make comparisons where relevant.
You should write at least 150 words.

Sample Band 9 Report
The two pie charts give statistical information on the sources of greenhouse gas emissions in Australia and New Zealand for last year.
Overall, it is interesting to note that in both Australia and New Zealand, various areas of agriculture were responsible for the most significant production of greenhouse gases last year.
The top three sources of greenhouse gas emissions in Australia were agricultural methane (29%), transport (25%) and electricity generation (19%). The first two were also the principal sources in New Zealand, although agricultural methane was slightly higher at 32% and transport was slightly lower at 19%.
The other four sources of greenhouse gas emissions in Australia were agricultural nitrous oxide, other energy, industrial processes and solvents and waste at 11%, 7%, 5% and 4% respectively. New Zealand was similar, though agricultural nitrous oxide (15%) was higher than electricity generation (10%). Other energy, industrial processes and solvents and waste followed in the same order as Australia, at 16%, 6% and 2% respectively.
Go here for more IELTS Band 9 Reports
Why did they use past tense in the main feature paragraphes? Is it better to use past tense or present?
Past tense is used because the chart describes data from last year. When there is no year specified in the task prompt, we assume the present and then it is fine to use the present tense.