This is a model response to a Writing Task 1 topic from High Scorer’s Choice IELTS Practice Tests book series (reprinted with permission). This answer is close to IELTS Band 9.
Set 1 Academic book, Practice Test 2
Writing Task 1
You should spend about 20 minutes on this task.
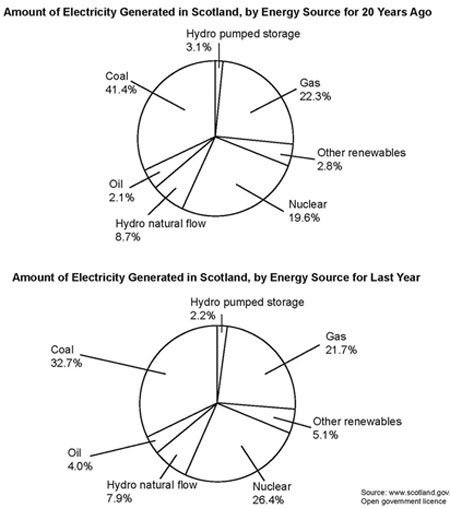
The pie charts below show the amount of electricity generated by energy source in Scotland for 20 years ago and last year.
Summarise the information by selecting and reporting the main features, and make comparisons where relevant.
You should write at least 150 words.

Sample Band 9 Report
The two pie charts show the amount of electricity generated by energy source in Scotland for twenty years ago and last year.
The various sources of energy used in Scotland and the amount of energy gained from each of them have not significantly changed when comparing the values from last year and twenty years ago. The greatest amount of electricity was generated from coal, with 41.4% being generated twenty years ago and 32.7% being generated last year; however, the sources of the energy generation have spread out more, when looking at last year’s data.
Compared to twenty years ago, Scotland has made slight changes to its reliance on certain sources for the generation of electricity. Although the major generator remains as coal (followed again by gas), there has been an increase in the use of oil (from 2.1% to 4.0%), nuclear energy (from 19.6% to 26.4%) and other renewable sources (from 2.8% to 5.1%). The most significant changes would be to the use of oil and other renewable sources, as the use of these two sources last year was almost double the percentage of electricity that was being generated from them twenty years ago.
Go here for more IELTS Band 9 Reports
Excellent
That’s great, thank you!
Is this you gurleen from maan village???
How are you?
Have you also started doing ielts