Skip to content

IELTS Reports- Band 9

IELTS Writing – samples of IELTS reports of Band 9 (Academic Writing Task 1)

IELTS Report, topic: Two pie charts describing the proportions of visits to Ireland by age, gender and type of visit (from IELTS High Scorer’s Choice series, Academic Set 2)

This is a model response to a Writing Task 1 topic from High Scorer’s Choice IELTS Practice Tests book series (reprinted with permission). This answer is close to IELTS Band 9.

Set 2 Academic book, Practice Test 9

Writing Task 1

You should spend about 20 minutes on this task.

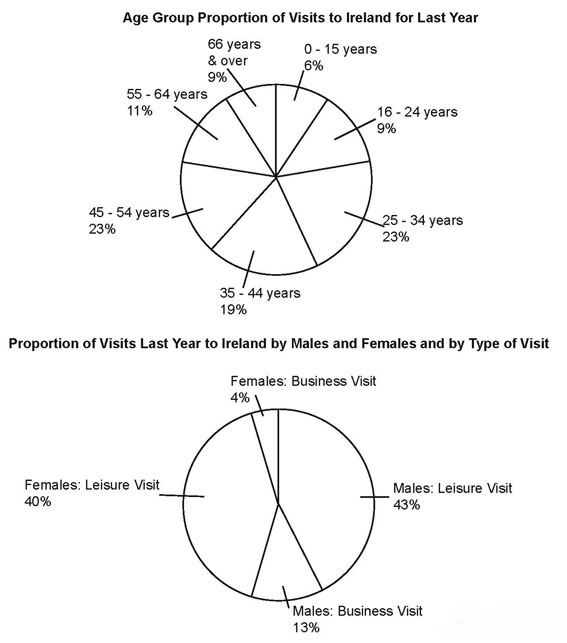
The pie charts below show the proportions of visits to Ireland last year by age group, and by gender and type of visit.

Summarise the information by selecting and reporting the main features, and make comparisons where relevant.

You should write at least 150 words.

Two pie charts describing the proportions of visits to Ireland by age, gender and type of visit (from IELTS High Scorer's Choice series, Academic Set 2 book)

Sample Band 9 Report

Both pie charts focus on the proportions of visits to Ireland last year. However, while one provides data on the proportion of the different age groups of people who visited Ireland last year, the second pie chart provides data on the gender of the visitors and their reasons for visiting.

It can be clearly seen that the 25-34 year old and 45-54 year old cohorts comprised the largest proportion of visitors and that most people came to Ireland for leisure, not business.

The first pie chart shows that three age groups made up most of last year’s visitors to Ireland. These were 25 to 34 year-olds (23%), 35 to 44 year-olds (19%), and 45 to 54 year-olds (23%). Four other age groups made up the rest, ranging from 6% to 11% of visitors.

The second pie chart shows that Ireland received last year more male visitors than female visitors (56% to 44%). Business trips to Ireland did not make up a very significant amount of trips, 17% in total; however, the amount of business visits conducted by males was much higher, 13%, compared to 4% female business visits.

Go here for more IELTS Band 9 Reports

IELTS Report, topic: Table and pie chart describing day and overnight stays in public and private hospitals in Australia (from IELTS High Scorer’s Choice series, Academic Set 2)

This is a model response to a Writing Task 1 topic from High Scorer’s Choice IELTS Practice Tests book series (reprinted with permission). This answer is close to IELTS Band 9.

Set 2 Academic book, Practice Test 8

Writing Task 1

You should spend about 20 minutes on this task.

The table below shows the numbers of same day and overnight stays in public and private hospitals in 5 Australian states for last year. The pie chart below shows percentages of same day and overnight stays in public and private hospitals in the same 5 Australian states.

Summarise the information by selecting and reporting the main features, and make comparisons where relevant.

You should write at least 150 words.

Table and pie chart describing day and overnight stays in public and private hospitals in Australia (from IELTS High Scorer's Choice series, Academic Set 2 book)

Sample Band 9 Report

The table and the pie chart both show last years’ visits to hospitals in Australia. The table shows the number of days that patients stayed at either public or private hospitals, while the pie chart shows the percentage of patients that stayed overnight or left the same day. Both charts present information for the same Australian states, New South Wales, Victoria, Queensland, Western Australia and South Australia.

The table shows the number of days patients stayed at general and psychiatric hospitals in the public and private sectors. The public general hospitals had far more patient days than public psychiatric hospitals for every state, with New South Wales having the highest general hospital patient stays at 5,816 days and South Australia having the fewest at 1,495 days. New South Wales also had the highest public psychiatric hospital patient stays at 281 days, although Victoria had the fewest at 59 days.

Patient days at private general hospitals were highest in Victoria (2,047 days) and lowest in South Australia (560 days). Patient days at private psychiatric hospitals were highest in New South Wales and Queensland at 213 days each, and lowest in South Australia (57 days).

Total numbers were highest for New South Wales (8,323 days) and lowest for South Australia (2,209 days), in line with their population sizes.

The pie chart divides the stays of the patients into overnight stays and same day stays for both private and public hospitals. From the chart it can be seen that the majority of the stays were in public hospitals both overnight and same day stays, both of these taking up 30% each of the hospital stays.

Go here for more IELTS Band 9 Reports