Skip to content

IELTS Reports- Band 9

IELTS Writing – samples of IELTS reports of Band 9 (Academic Writing Task 1)

IELTS Report, topic: Five line graphs showing the annual visitor spend in New Zealand (from IELTS High Scorer’s Choice series, Academic Set 3)

This is a model response to a Writing Task 1 topic from High Scorer’s Choice IELTS Practice Tests book series (reprinted with permission). This answer is close to IELTS Band 9.

Set 3 Academic book, Practice Test 13

Writing Task 1

You should spend about 20 minutes on this task.

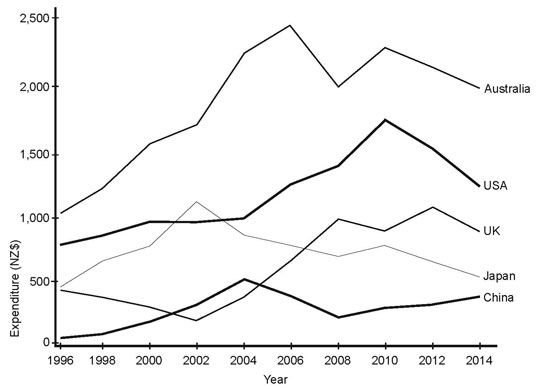
The graph below shows the annual visitor spend for visitors to New Zealand from 5 countries for the years 1996 to 2014.

Summarise the information by selecting and reporting the main features, and make comparisons where relevant.

You should write at least 150 words.

5 line graphs showing annual visitor spend in New Zealand (from IELTS High Scorer's Choice series, Academic Set 3 book)

Sample Band 9 Report

The graph shows the amount of money tourists from five different countries spent while visiting New Zealand between the years 1996 and 2014. The five countries compared are Australia, the USA, the UK, Japan and China.

It is clear that the amount of money spent in New Zealand by tourists from almost all the named countries increased from 1996 to 2014, although there were some fluctuations along the way.

In 1996, Australian citizens spent the most, at NZ$1,000 per person, followed by tourists from the USA, Japan, the UK and, finally, China at NZ$100 per visitor. Most countries experienced growth in visitor spend during the 18-year period that peaked at various points in time for different countries, and then declined. Australia’s spending, for instance, peaked at NZ$2,500 in 2006, whereas the USA reached a top of NZ$1,700 in 2010. China’s peak in 2004 was the lowest of all the countries (NZ$500).

In spite of the decline in spending that the countries experienced, overall, tourists were spending more at the end of the period compared to the beginning. In 2014, Australia’s visitors spent the most at NZ$2,000, followed by tourists from the USA, UK, Japan and China, at NZ$400 per person. The only country whose citizens spent the same amount in 1996 and 2014 was Japan (about NZ$500 per person).

Go here for more IELTS Band 9 Reports

IELTS Report, topic: Two bar charts showing the prevalence of obesity among boys and girls (from IELTS High Scorer’s Choice series, Academic Set 3)

This is a model response to a Writing Task 1 topic from High Scorer’s Choice IELTS Practice Tests book series (reprinted with permission). This answer is close to IELTS Band 9.

Set 3 Academic book, Practice Test 12

Writing Task 1

You should spend about 20 minutes on this task.

The bar charts below show the prevalence of obesity among boys and girls aged 12 to 19 years by ethnicity, in the United States for the years 2004 and 2014.

Summarise the information by selecting and reporting the main features, and make comparisons where relevant.

You should write at least 150 words.

Two bar charts showing the prevalence of obesity among boys and girls (from IELTS High Scorer's Choice series, Academic Set 3 book)

Sample Band 9 Report

This report refers to two bar charts. The first gives data on obesity in boys by ethnicity between the ages of twelve and nineteen in the United States for 2004 and 2014, and the second gives the same data for girls.

Overall, it is clear that in both demographics the percentage of obese teenagers increased by 2014, with Hispanic boys and Non-Hispanic Black girls being the most at risk.

In boys, the obesity figures for 2004 were similar for all three ethnicities given, at 12, 11 and 13 per cent for Non-Hispanic White, Non-Hispanic Black and Hispanic respectively. In 2014, these figures rose to 17, 20 and 27 per cent for the same ethnicities. All the figures for 2014 are significantly higher compared to 2004, especially the last, with over a quarter of this ethnic group being classed as obese.

In girls, the obesity figures for 2004 were similar to boys for Non-Hispanic White and Hispanic, at 9 and 12 per cent respectively. The figure for Non-Hispanic Black was significantly higher for girls at 16 per cent. In 2014, Non-Hispanic White and Hispanic both rose 5 per cent and remained less than their male counterparts. Non-Hispanic Black girls, however, rose to 29 per cent, which is the highest figure in both charts.

Go here for more IELTS Band 9 Reports