Skip to content

IELTS Reports- Band 9

IELTS Writing – samples of IELTS reports of Band 9 (Academic Writing Task 1)

IELTS Report, topic: Bar chart describing Scotland’s exports (from IELTS High Scorer’s Choice series, Academic Set 3)

This is a model response to a Writing Task 1 topic from High Scorer’s Choice IELTS Practice Tests book series (reprinted with permission). This answer is close to IELTS Band 9.

Set 3 Academic book, Practice Test 11

Writing Task 1

You should spend about 20 minutes on this task.

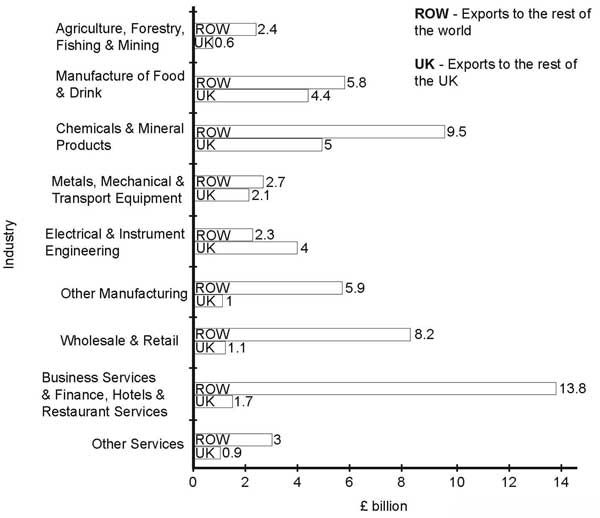
The bar chart below shows Scotland’s exports to the rest of the UK and the rest of the world for the year 2014.

Summarise the information by selecting and reporting the main features, and make comparisons where relevant.

You should write at least 150 words.

Scotland’s Exports to the Rest of the UK and the Rest of the World – 2014

Bar Chart of Scotland's Exports to the Rest of the UK and the Rest of the World in 2014 (from IELTS High Scorer's Choice series, Academic Set 3 book)

Sample Band 9 Report

This report concerns a bar chart, which compares Scotland’s exports in different areas of industry to the rest of the UK with its exports to the rest of the world in 2014.

It is evident that exports to the rest of the world were much more significant to the Scottish economy than those to the rest of the UK.

The bar chart shows that in 2014 Scotland exported more to the rest of the world than to the rest of the UK in all the industries mentioned with one exception. The Electrical & Instrument Engineering industry exports were £4 billion to the rest of the UK compared to £2.3 billion going to the rest of the world.

In other industry sectors, the difference in exports was most significant in the Business Services & Finance, Hotels & Restaurant Services Industry, with exports to the rest of the world worth £13.8 billion and exports to the UK worth only £1.7 billion. Other notable sectors were Wholesale & Retail with roughly £7 billion of difference between exports to ROW and the rest of the UK, Chemicals & Mineral Products and Other Manufacturing where the difference between exports to the rest of the world and those to the rest of the UK was approaching £5 billion.

Go here for more IELTS Band 9 Reports

IELTS Report, topic: Process diagram describing the life-cycle of the car (from IELTS High Scorer’s Choice series, Academic Set 2)

This is a model response to a Writing Task 1 topic from High Scorer’s Choice IELTS Practice Tests book series (reprinted with permission). This answer is close to IELTS Band 9.

Set 2 Academic book, Practice Test 10

Writing Task 1

You should spend about 20 minutes on this task.

The diagram below shows the product life-cycle of the car.

Summarise the information by selecting and reporting the main features, and make comparisons where relevant.

You should write at least 150 words.

The Product Life-cycle of the Car

Process Diagram of the Product Life-cycle of the Car

Sample Band 9 Report

The diagram describes the life cycle of a car, starting with mining of raw materials and ending with scrapping of unrecyclable parts.

It is clear that recycling of materials and parts plays a big role in the process.

The starting place of the cycle is the mining of the raw materials, which are then used to manufacture car components or delivered straight to the factory. This then leads to the cars being manufactured and in turn sold, usually through dealerships, and used. It is stated that on average, a car has about three owners, and during the car’s use, the car gets serviced and repaired.

Once the cars have been used up to their capacity and they do not work properly anymore, then they are sold for scrap. If the still functioning or reusable parts and materials can be recycled, they can either be formed into components again, or delivered back to a factory for re-use. The life cycle of the car then begins again. All the parts that cannot be recycled are scrapped and this constitutes the end of car’s life.

Go here for more IELTS Band 9 Reports