Skip to content

IELTS Reports- Band 9

IELTS Writing – samples of IELTS reports of Band 9 (Academic Writing Task 1)

IELTS Report, topic: Multiple line graph describing the percentage of students learning a second language (from IELTS High Scorer’s Choice series, Academic Set 2)

This is a model response to a Writing Task 1 topic from High Scorer’s Choice IELTS Practice Tests book series (reprinted with permission). This answer is close to IELTS Band 9.

Set 2 Academic book, Practice Test 7

Writing Task 1

You should spend about 20 minutes on this task.

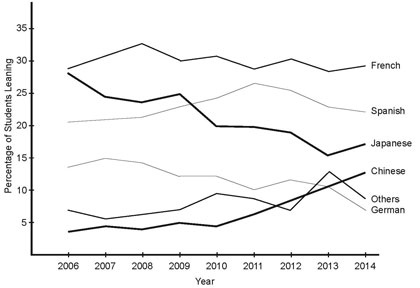
The graph below shows the percentage of New Zealand primary school students learning a second language by language learned for the years 2006 to 2014.


Summarise the information by selecting and reporting the main features, and make comparisons where relevant.

You should write at least 150 words.

Percentage of New Zealand Primary School Students Learning a Second Language by Language Learned; 2006 – 2014

Multiple line graph describing the percentage of students learning a second language (from IELTS High Scorer's Choice series, Academic Set 2 book)

Sample Band 9 Report

The graph shows the percentages of New Zealand primary school students who were learning a second language for the years 2006 to 2014.

It can be clearly seen that the popularity of various languages amongst school children changed over the years. Even languages that started off as equally popular in 2006 experienced a change in demand by 2014.

In 2006, the most common second language students learned in New Zealand primary schools was French (29%), with Japanese (28%) following very close behind. In 2014, the most common second language learned in primary school was still French at around the same percentage, however, the second most common had switched to Spanish (23%). Japanese dropped from its 2006 high of 28% to 17% in 2014.

The two least commonly learned second languages were German and Chinese. Chinese, which in 2006 had been the least commonly learned language at under 5%, dramatically increased and reached around 12% in 2014. German, which in 2006 had been the most common of the bottom three of the results given with 12%, steadily decreased to around 6% in 2014. “Other languages” groups various languages that are not stated. These were at 7% in 2006, but became more popular over the years, reaching around 9% in 2014 after having peaked in the previous year.

Go here for more IELTS Band 9 Reports

IELTS Report, topic: Two pie charts describing UK tax revenue and government spending (from IELTS High Scorer’s Choice series, Academic Set 2)

This is a model response to a Writing Task 1 topic from High Scorer’s Choice IELTS Practice Tests book series (reprinted with permission). This answer is close to IELTS Band 9.

Set 2 Academic book, Practice Test 6

Writing Task 1

You should spend about 20 minutes on this task.

The pie charts below show the sources for UK tax revenue for last year and the total UK government spending for last year.


Summarise the information by selecting and reporting the main features, and make comparisons where relevant.

You should write at least 150 words.

Two pie charts describing UK tax revenue and government spending (from IELTS High Scorer's Choice series, Academic Set 2 book)

Sample Band 9 Report

This report is describing two pie charts, one that shows the sources for UK tax revenue and another that shows how the UK government spent their money. Both charts show statistics from last year.

It can be clearly seen that income tax was the biggest source of revenue for the UK, and pensions were the largest expenditure area.

The sources that the UK government was most dependent on last year were income tax, which made up 28% of tax revenue, national insurance taxes, which made up 21% and value added tax, which made up 17%. The sources that contributed the least to tax revenue were fuel duty, business rates and council tax, each making up 5% of total revenue. The remaining sources of money for the UK government were corporation tax (8%) and other, undefined sources (11%).

The pie chart describing the total UK government spending for last year shows that most of the money gained from taxation went on pensions (20%), health care (18%), welfare (17%) and education (14%). The least amount of money went to general government and to transport, both areas receiving 3% of the money each. 7% of the money went to other spending, and the remaining money went to defense (7%), interest payments on debt (6%) and protection in the form of law, police, fire department etc. (5%).

Go here for more IELTS Band 9 Reports