Skip to content

IELTS Reports- Band 9

IELTS Writing – samples of IELTS reports of Band 9 (Academic Writing Task 1)

IELTS Report, topic: Flow charts of circles of poverty (from IELTS High Scorer’s Choice series, Academic Set 3)

This is a model response to a Writing Task 1 topic from High Scorer’s Choice IELTS Practice Tests book series (reprinted with permission). This answer is close to IELTS Band 9.

Set 3 Academic book, Practice Test 15

Writing Task 1

You should spend about 20 minutes on this task.

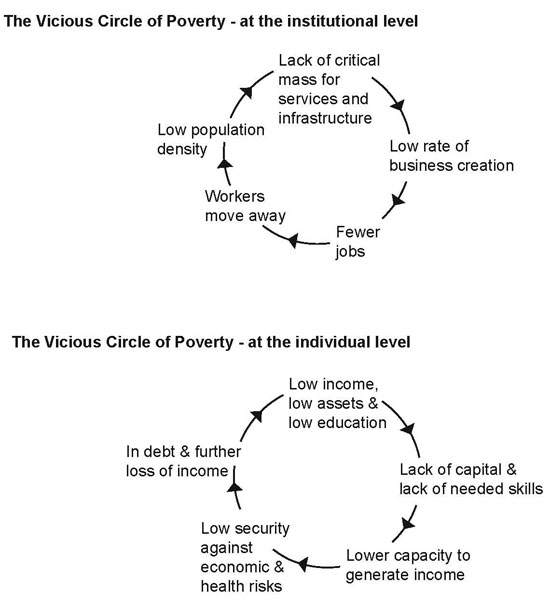
The flow charts below show the vicious circles of poverty at the institutional and individual levels.

Summarise the information by selecting and reporting the main features, and make comparisons where relevant.

You should write at least 150 words.

Multiple bar chart of US processed food export markets (from IELTS High Scorer's Choice series, Academic Set 3 book)

Sample Band 9 Report

The two flow charts describe circles of poverty, however, they look at them from different perspectives. The first flow chart looks at poverty from an institutional level, while the second looks at it from the perspective of an individual.

Overall, it can be seen that at both levels, individual and institutional, poverty perpetuates itself.

The first flow chart explains how poverty results in the lack of a critical mass for service and infrastructure, which can lead to lower business creation. This in turn leads to fewer jobs and the moving away of workers, so they can find a job elsewhere. If workers begin to move away, then the population density of the cities decreases, which then again influences the lack of a mass needed for the infrastructure. And so the circle continues.

The second flow chart looks at the more personal hardships of poverty, starting with low income, low assets and low education in an individual. Low education leads to a lack of skills and a lack of capital, which makes it even harder for an individual to generate income. This provides an individual with only a low security against economic and health risks and can lead to debt and a further loss of income.

Go here for more IELTS Band 9 Reports

IELTS Report, topic: Multiple Bar Chart of US’ Processed Food Export Markets (from IELTS High Scorer’s Choice series, Academic Set 3)

This is a model response to a Writing Task 1 topic from High Scorer’s Choice IELTS Practice Tests book series (reprinted with permission). This answer is close to IELTS Band 9.

Set 3 Academic book, Practice Test 14

Writing Task 1

You should spend about 20 minutes on this task.

The bar chart below shows the US’ top ten processed food export markets for last year and six years ago.

Summarise the information by selecting and reporting the main features, and make comparisons where relevant.

You should write at least 150 words.

Top 10 US Processed Food Export Markets (for last year and 6 years ago)
Multiple bar chart of US processed food export markets (from IELTS High Scorer's Choice series, Academic Set 3 book)

Sample Band 9 Report

The bar chart gives data on the top ten processed food export markets for the United States from last year and six years ago.

It can be clearly seen that all the countries in the bar chart imported more processed food from the US last year than 6 years ago.

The largest market by far for last year and six years ago was Canada, with income for the US of 13.2 billion US dollars and 9.3 billion US dollars, respectively. The second highest figures were for what is identified as the Rest of World at 11 billion US dollars and 6.3 billion US dollars, respectively.

The remaining eight countries ranged from Mexico with income for the US of 6.1 billion US dollars for last year and 4 billion US dollars for six years ago to Hong Kong with income for the US of 0.8 billion US dollars for last year and 0.3 billion US dollars for six years ago. Therefore, the two largest markets the US depends on for their processed food exports were the closest ones, Canada and Mexico.

Compared to 6 years ago, last year US processed food exports to Australia experienced the most significant growth of 300%, to China, Hong Kong and the Philippines – just over 200%, and to the other countries – under 100%.

Go here for more IELTS Band 9 Reports