Skip to content

IELTS Reports- Band 7

IELTS Writing – samples of IELTS reports of Band 7

IELTS report, topic: Double line graph describing the birth rate in China and the USA

You should spend about 20 minutes on this task.

The graph below compares the changes in the birth rates of China and the USA between 1920 and 2000.

Summarise the information by selecting and reporting the main features and make comparisons where relevant.

Write at least 150 words.

Line graph birth rates in China and the USA

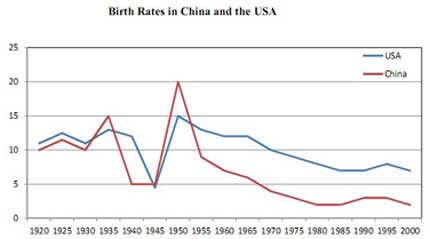
The graph some striking similarities between the Chinese and the US birth rates from 1920 to 2000. Both countries experienced considerable fluctuations in the similar period with during the 1940s and during the .

The birth rates in China rose from 10% in 1920 to 15% in 1935. Later, the figure plunged to a low of 5% in the 1940s and was followed by an exponential growth to the peak of 20% in 1950. Next, the fertility rate dropped sharply to 8% in the following five years. Finally, the figure declined gradually to 3% during the latter half of the century.

Meanwhile, the US had similar birth rate of 12% to that of China in 1920. The figure fluctuated in between 12% and 14% during 1920s and 1930s until it hit a low of 4% in 1945. Five years later, the birth rate reached a peak at 15% in 1950 but it made a steady fall to the final figure of around 7% in 2000.

This report covers the requirements of the task. The main trends / features were sufficiently developed. The candidate has arranged ideas coherently, though the use of linking words can be improved. The range of vocabulary is adequate. There are a few errors in grammar and word choice, and one instance of inaccurate data. Overall, the task response meets the expectations and seems good enough to achieve Band 7.

Click here to see more IELTS reports of band 7

demonstrates
a fall
a peak
1950s

IELTS report, topic: Table describing different types of families living in poverty

You should spend about 20 minutes on this task.

The table below shows the proportion of different categories of families living in poverty in Australia in 1999.
Summarise the information by selecting and reporting the main features, and make comparisons where relevant.

Write at least 150 words.

Families living in poverty table

The table shows a breakdown of different types of families who were living in poverty in Australia in 1999.

It is noticeable that 11% of people were living in poverty. However, this figure was considerably high among the sole parents and single people who did not have children and percentages were 21% and 19% respectively. Moreover, this proportion was significantly prominent among the couples who had children compared with couples who did not have children. In fact, the proportion of couples with children living in poverty was 5% than that in the family types only couples. In contrast, this trend favoured aged people. However, this figure was slightly (2%) among the single aged people than that in the family category of aged couples.

In conclusion, it is clear that the proportion of people living in poverty varied according to their family structures.

This report covers the requirements of the task. The main trends / features were mentioned, but could have been developed more fully. The candidate has arranged ideas coherently. The range of vocabulary is sufficient, even though it lacks flexibility to some extent. There are a few grammatical mistakes in the report. Overall, the task response meets the expectations and seems good enough to achieve Band 7.

Click here to see more IELTS reports of band 7

their
delete this
bigger
that consisted of
delete this
higher