Skip to content

IELTS Reports- Band 7

IELTS Writing – samples of IELTS reports of Band 7

IELTS Report, topic: Bar graph describing trends in consumption of fast food

You should spend about 20 minutes on this task.

The chart below shows the amount of money per week spent on fast foods in Britain. The graph shows trends in consumption of fast foods. Write a report for a university lecturer describing the information shown below.

Summarise the information by selecting and reporting the main features and make comparisons where relevant.

Write at least 150 words.

Two charts showing trends in consumption of fast food

The bar chart illustrates the expenditure on three different types of fast food hamburgers, fish and chips and pizza in different .

From the chart, it is clear that in a high-income group, 40 pence is spent on hamburgers a week, which is the largest among the expenditures on all the three types of fast food. This expenditure is also the greatest one in the average income group, but the amount of money spent is only about 33 pence a week, less than that in the high-income group. As for the low-income group, the largest expenditure is on fish and chips, about 18 pence a week.

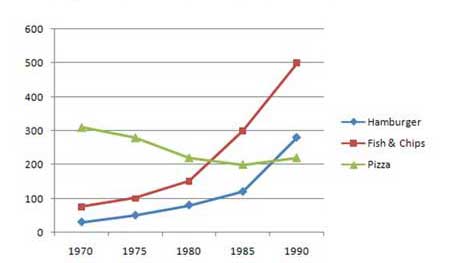
The line graph compares the trends of the amount of three of fast food consumed between 1970 and 1990. It is clear that the amount of hamburgers and fish and chips consumed showed an increasing trend, while pizza gradually decreased from 300g in 1970 to in 1985, before it grew to about 240g in 1990. The consumption of fish and chips overtook that of pizza and hamburgers in 1982 and 1988 respectively.

This report covers the requirements of the task. The main trends and features were presented but should be developed better. The candidate has arranged ideas coherently, though the data is reported in a repetitive way. The range of vocabulary is adequate. There are a few errors in grammar and word choice, and one instance of inaccurate data (mouse over the underlined words shows corrections). Overall, this task response meets the expectations and seems good enough to achieve Band 7.

Click here to see more IELTS reports of band 7

namely
by people
income groups
significantly
types
consumption
200g

IELTS Report, topic: Line graph describing the consumption of fish and meat

You should spend about 20 minutes on this task.

The graph below shows the consumption of fish and different kinds of meat in a European country between 1979 and 2004.

Summarise the information by selecting and reporting the main features and make comparisons where relevant.

Write at least 150 words.

Line graph of the consumption of fish and meat in a European country

The graph illustrates the quantities of fish and different kinds of meats consumed in a European country the time period 1979 and 2004. Over this span of 25 years, the consumption of beef, lamb and fish decreased while the consumption of chicken has dramatically risen.

The biggest consumption in 1979 was (about 220 grams per person was consumed every week) while the lowest consumption in 1979 was (around 60 gram ). The amount of fish which was eaten remained almost constant at about 50 grams from 1979 2004. The trends of beef and lamb consumption were similar, with decreases in amount in between the years. While beef consumption had declined from over 200 grams per person per week to around 100 grams during 25 years, 150 grams to approximately 50 grams the same period.

In contrast, chicken consumption had gradually a peak at 250grams per person week between 1994 and 2004.

This report covers the requirements of the task. The main trends and features were sufficiently developed. The candidate has arranged ideas coherently, though at times they report data in a repetitive way. The range of vocabulary is adequate. There are a few errors in grammar and word choice (mouse over the underlined words shows suggestions for improvement). Overall, this task response meets the expectations and seems good enough to achieve Band 7.

Click here to see more IELTS reports of band 7

in
between
has
that of beef
that of fish
you can write ‘per person per week’ to avoid repetition
delete this
until
lamb consumption fell from
during
risen
and reached
per
delete this