Skip to content

IELTS Reports- Band 7

IELTS Writing – samples of IELTS reports of Band 7

IELTS Report, topic: A line graph of wages growth

You are advised to spend a maximum of 20 minutes on this task.

The graph below gives information on wages of Somecountry over a ten-year period. Write a report for a university tutor describing the information shown.

You should write at least 150 words.

Wages growth line graph

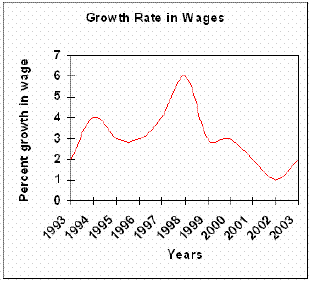
The describes the growth of wages in Somecountry from the year 1993 to 2003.

The growth started at two percent in 1993, but it didn’t stay there very long before it rapidly doubled in 1994. Further on, the percentages to three percent in 1995, stayed steady for a year, before starting to rise slowly and ending up just under four percent in 1997. 1998 was the best year where the wages growth peaked at six percent.

However, after 1998 the wages grew less and less nearly every year. Only a year , the percentage dropped to well under three percent, and stayed there on roughly three percent till 2000. In 2002 the wages reached the lowest point of just one percent growth. Luckily the growth rose in 2003 at under two percent.

Overall, the growth rate in wages in Somecountry has shown striking changes through the ten years.

This is a good report. It covers the task, is divided correctly into paragraphs and the vocabulary is suitable. Its problems are that it has fewer than 150 words (146) and there are some grammatical errors. Assuming the corrections were made, this looks like a Band 7 report.

Click here to see more IELTS reports of band 7

line graph
declined
later
just

IELTS Report, topic: Table of home schooled students’ percentages

You are advised to spend a maximum of 20 minutes on this task.

The table below describes percentages of home schooled students in SomeCountry in 1999-2004. Write a report for a university lecturer describing the information shown.

You should write at least 150 words.

Homeschooled table

This table shows students in Somecountry in years 1999-2004 in .

The main trend is that all grades including kindergarten growing every year. Kindergarten started 2.4 and ended highest at 2.9 percent with a constant increase. grades 1-2 and grades 5-6 a little different trend, both at 1,5 percent in 1999 and a little bit in 2000. Both of them increased slowly in 2002 and both that course to 2004 where grades 1-2 2,1 percent and grades 5-6 2.6 percent.

Grades 3-4 a slow but steady growth all six years. It at 1.6 percent in 1999 and 0.1 every year except in 2003 when it 0.2 percent. Grades 7-8 at 1.6 percent and there for three years until they rapidly rose up to 2.2 and peaked at 2.5 in 2004.

Overall, all grades including kindergarten has had a rise at minimum 1 percent or more in 6 years.

This is a good report; here is how you can make it better: the coherence needs improvement, meaning the logical connection between sentences inside a paragraph and between paragraphs. Use more connective words (Furthermore, However, etc).

The grouping you’ve done is fine, but try to use more variations describing those statistics: use words such as numbers, figures, percentages, etc. The grammar and the spelling need some extra attention.Overall, this report seems worthy of Band 7

Click here to see more IELTS reports of band 7

home schooled
percentages
were
remove ‘for’
with percentage of
Not quite similarly
showed
started
declined
held
reached
reached
had
throughout
started
increased by
peaked up at
started
stayed
roughly