
This is a model answer for an Academic Writing Task 1 from the IELTS exam in India and Nepal, shared recently. This response is likely to get Band 8 or 8.5 in IELTS.
You should spend about 20 minutes on this task
The charts below describe 4 sectors of employment, in 2009 and 2020, in two towns. Summarise the information by selecting and reporting the main features, and make comparisons where relevant.
Write at least 150 words
* Note: these aren’t the actual charts given in the test, they were recreated for the purpose of demonstration.

Band 8.5 Model Answer
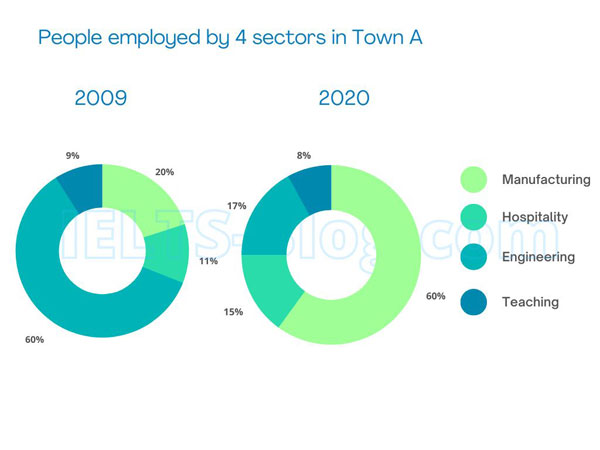
The two pie charts show information about employment in Manufacturing, Hospitality, Engineering and Teaching in 2 towns in the years 2009 and 2020.
Overall, it can be clearly seen that there was a significant increase in the number of people employed in Manufacturing in Town A, while Town B experienced a substantial decline in the same sector.
Taking a closer look at Town A, the amount of people employed in the Manufacturing sector tripled from 20% in 2009 to 60% in 2020, while the Engineering sector experienced a sharp decrease during the same period, from 60% to 17%, in an inverse pattern to Manufacturing sector’s figures. The changes to Hospitality and Teaching sectors’ employment were quite minor in both years, with Hospitality slightly increasing from 11% to 15% and Teaching staff numbers shrinking from 9% to 8%.
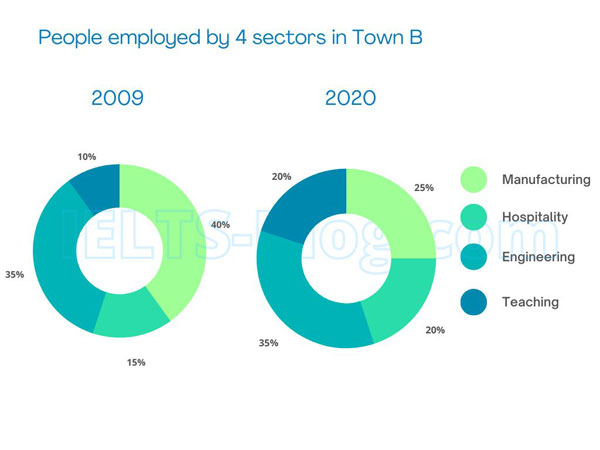
Moving on to Town B, Hospitality and Teaching experienced growth of similar proportions, with Teaching increasing twofold from 10% in 2009 to 20% in 2020 and Hospitality slightly less, from 15% in 2009 to 20% in 2020. The Manufacturing sector witnessed a large reduction in figures, from 40% to 25%, while Engineering had no changes.
Click here to see more IELTS reports of band 8
great
I’m glad you are finding this helpful!
Thanks for this,glad I came across your page
We’re glad that you’re here, Lydia! Welcome and please comment or contact us if there’s anything we can do for you.