Skip to content

IELTS Speaking test in Jeddah, Saudi Arabia – January 2013

IELTS Speaking test in Jeddah, Saudi Arabia – January 2013

These questions were shared by A who recently took the IELTS test in Saudi Arabia.

Speaking testIELTS test in Saudi Arabia

Interview

– What is your full name?
– Are people in your country using mobile phones often?
– When did you get your first mobile phone?
– Do you prefer to call or to message your friends? Why?
– Do you think people should turn their cell phones on silent in public places? Why?
– Please describe your hometown.
– What is interesting in your hometown?
– Are you planning to stay or go back to your hometown in the future?

Cue Card

If you were given a chance to do an unusual job, what job would it be? Please say:

– Why do you think it is an unusual job?
– Where did you find out about it?
– What is so interesting about this job?

Discussion

– Is it important to have a retirement age?
– Is a part time job in your country supported by schools?
– Does government have the right to impose a particular number of workers on a company?
– In what way students are guided to choose their career?
– How do you decide what course or degree will suit you?

IELTS Report, topic: Line graph describing the consumption of fish and meat

You should spend about 20 minutes on this task.

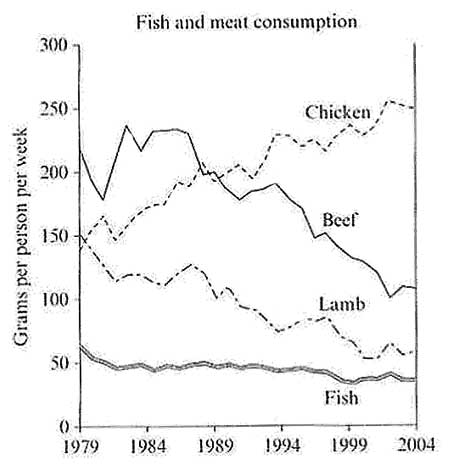
The graph below shows the consumption of fish and different kinds of meat in a European country between 1979 and 2004.

Summarise the information by selecting and reporting the main features and make comparisons where relevant.

Write at least 150 words.

Line graph of the consumption of fish and meat in a European country

The graph illustrates the quantities of fish and different kinds of meats consumed in a European country the time period 1979 and 2004. Over this span of 25 years, the consumption of beef, lamb and fish decreased while the consumption of chicken has dramatically risen.

The biggest consumption in 1979 was (about 220 grams per person was consumed every week) while the lowest consumption in 1979 was (around 60 gram ). The amount of fish which was eaten remained almost constant at about 50 grams from 1979 2004. The trends of beef and lamb consumption were similar, with decreases in amount in between the years. While beef consumption had declined from over 200 grams per person per week to around 100 grams during 25 years, 150 grams to approximately 50 grams the same period.

In contrast, chicken consumption had gradually a peak at 250grams per person week between 1994 and 2004.

This report covers the requirements of the task. The main trends and features were sufficiently developed. The candidate has arranged ideas coherently, though at times they report data in a repetitive way. The range of vocabulary is adequate. There are a few errors in grammar and word choice (mouse over the underlined words shows suggestions for improvement). Overall, this task response meets the expectations and seems good enough to achieve Band 7.

Click here to see more IELTS reports of band 7

in
between
has
that of beef
that of fish
you can write ‘per person per week’ to avoid repetition
delete this
until
lamb consumption fell from
during
risen
and reached
per
delete this