This report was written on a topic from “Target Band 7” book (page 41, reprinted with permission).
You should spend about 20 minutes on this task
The graph describes average house prices in Sometown in 2005.
Write a report for a university tutor describing the information shown.
Write at least 150 words
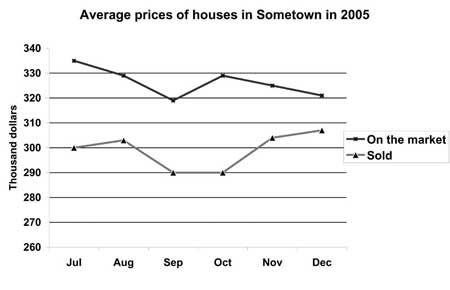

The line graph shows the average cost of housing in Sometown in the second half of the year 2005. It is clear that the prices of both sold and unsold houses had fluctuated over the period.
According to the graph, the asking price of unsold properties peaked in July at around $335,000 dollars and then the figure decreased to its lowest level of nearly $319,000, which was reached in September. A slight fluctuation occurred in the following months the average prices of homes for sale increased by 10 thousand dollars in October and declined to just above 320,000 dollars in December.
Similarly, the average price of sold properties had varied widely over the period, except the values were lower. The months of July and August recorded average prices of around $300,000 and $303,000 dollars respectively. Then, prices reached the bottom at 290,000 in the next two months before rose significantly and registered highest value in December at almost $308,000.
In conclusion, there was a significant difference between the asking and selling price and the gap narrowed towards the end of 2005 as sellers’ expectations moved closer to achievable prices.
This response handles well the description of both asking and selling average prices, as well as comparison of their trends. The use of cohesive devices is varied and the message is easy to follow. The writer uses complex sentence structures and wide range of vocabulary. The errors in word choice are minor and don’t affect communication. Overall, this looks like a Band 8 report.
Click here to see more IELTS reports of band 8
Rukhala