This report was written on a topic from “Target Band 7” book (page 41, reprinted with permission).
You should spend about 20 minutes on this task
The graph below shows how prices of “high-tech gadgets” changed over time in Somecountry.
Write a report for a university tutor describing the information shown.
Write at least 150 words
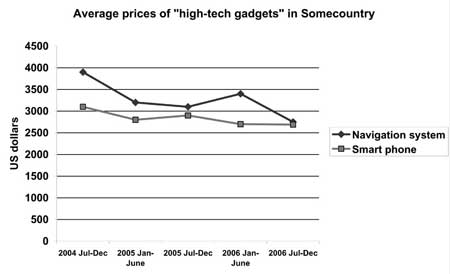

The line graph outlines the selling price of two advanced products, namely navigation systems and smart phones, in Somecountry between the last six months of 2004 and the last six months of 2006. It can be clearly seen that there was a considerable decrease in the pricing of navigation systems compared to mobile phones.
In July-December of 2004, the overall price of navigation was higher than . The former started at nearly $4,000 USD while the latter sold at around $3,100 USD. In the next six months, both items were priced at a lower value slipping to $3,300 and $2,800 USD (navigation systems and phones respectively). The pricing for navigation systems continued to drop to $3,100 USD in the following 6 months. Conversely, mobile phone prices went up marginally by around $100 USD. In the first half of 2006, the pricing trend changed for both products as navigation devices saw a rise to $3,400 USD while phones dipped to $2,700 USD. By the end of the year 2006, both items were sold at exactly the same price of $2,700 USD.
To sum up, it is evident that over the course of 2 years high tech gadgets declined in price and the more expensive product suffered a more significant price drop.
The entire graph was described in this well-organised and developed response. There are some minor grammatical mistakes, but they are quite rare. The vocabulary could have been enhanced further. Overall, this report seems worthy of Band 8.
Click here to see more IELTS reports of band 8
The given chart illustrate how the prices of navigation system and smart phones changed in somecountry during July 2004 to Dec 2006.
In 2004 july to december the prices of navigation system was at the peak that is almost 4000 similar the prices of smart phones was around 3000 the highest ever. In the first half of 2005 there is a huge drop in the prices of navigation system it dropped down and reached at 3200.while the price of smart phones drop slightly and reached at 2700.
In the period of july-dec 2006 the prices of both gadgets reached at almost same prices . There is a minor increase in the prices of smart phones and and decrease in the prices of navigation systems that is 3100 and 2900.
During first half of 2006 the navigation prices again rose up at 3500 while the prices of smart phones dropped and come at 2200. In the period of july-december 2006 the prices for mobile phones remain same although the prices of navigation system dropped and this is the first time both gadgets had the same prices that is 2200.