You should spend about 20 minutes on this task.
The graph below shows the popularity of different fast foods in Britain and the trends in their consumption. Write a report for a university lecturer describing the information shown below.
Summarise the information by selecting and reporting the main features and make comparisons where relevant.
Write at least 150 words.

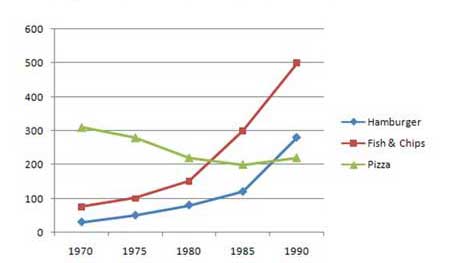
The graph shows the changes in the demand for hamburgers, fish chips and pizza from 1970 to 1990.
It is immediately apparent that in 1970 the most popular food was pizza. The demand for pizza started from 300 grams followed by a spectacular fall of 200 grams in 1985.
The striking feature of the graph is the demand for fish chips. In 1970, fish chips were the second favourite food among people, and from 1980 on the total demand surged to a high of 500 grams from 99 in 1970.
Furthermore, hamburgers were the least popular food in 1970 with the total demand of 15 grams, which increased gradually till 1985. The total demand for hamburgers skyrocketed to 299 grams in 1990.
In conclusion, there was a increase in the demand for hamburgers and sea food, whereas there was a significant fall in the popularity of pizza.
Teacher’s summary: All the requirements of the task were covered fairly well. The key features were identified, emphasized and illustrated in a suitable and logical way. The ideas are presented in a logical order. All aspects of cohesion are taken care of well. The paragraphing is handled suitably and appropriately. The range of vocabulary allows the writer to communicate the exact meanings. Some sophisticated words/expressions are used in a clever way. A wide range of grammatical structures are used. Overall, this report seems worthy of IELTS Band 8.
Click here to see more IELTS reports of band 8

Pingback: IELTS Sample Reports of Band 8 | IELTS-Blog
This app is very good
This is great to hear, thanks Yash!
What Band approximately will this essay fall into?
Line graph illustrates the popularity of various fast foods from 1970 to 1990. Overall, Pizza exhibited a decline with some fluctuations in between while Hamburger and Fish & Chips continuously rose in popularity.
Pizza initially was most favoured with an average consumption of 300g followed by Hamburger and Fish & Chips respectively in 1970. Then, demand for pizza steadily declined and reached a minimum of 200g in 1985 before recovering slightly to 210g in 1990. Conversely, Hamburger and Fish & Chips displayed mirroring trends of growth from 1970 to 1980.
From 1980 to 1985 , Fish & chips experienced a 150g surge in average consumption from 150g while Hamburgers saw a marginal uptick of approximately 20g. Both fast foods continued to increase with Hamburgers reaching its peak of 500g , becoming the dominant fast food while Fish & chips registered its highest of 290g in 1990.