This is a model answer for an Academic Writing Task 1 from the IELTS exam in Iran, shared recently. This response is likely to get Band 8 or 8.5 in IELTS.
You should spend about 20 minutes on this task
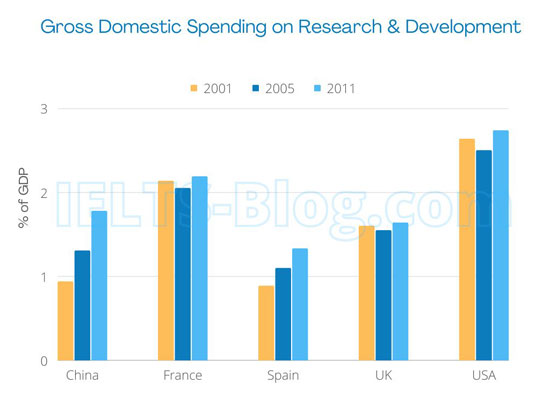
The bar chart below describes the gross domestic spending on Research and Development in five countries between 2001 and 2011. Summarise the information by selecting and reporting the main features, and make comparisons where relevant.
Write at least 150 words

Band 8.5 Model Answer
The bar chart describes the gross domestic expenditure on research and development by China, France, Spain, the UK and the USA during the years 2001, 2005 and 2011.
Overall, it can be seen that there was a general upward trend in the spending of all of 5 countries, albeit to varying degrees.
The USA spent the most on R&D in all three years, with the annual expenditure slightly increasing from 2.5% in 2001 to 2.8% of the country’s GDP in 2011. On the other end of the spectrum, Spain spent the least, starting at just below 1% in 2001 and finishing at around 2.3%.
China’s spending grew more than that of other countries, about 0.5% each year, and increased from about 0.9% in 2001 to around 2.8% in 2011. The remaining two countries, France and the UK, showed a similar pattern and their spending held relatively steady throughout the decade, at around 2% and 1.5% of GDP, respectively.
Click here to see more IELTS reports of band 8
MULTIPLE ERRORS BY THIS WRITER. Could be better, he/she even ended up with unknown word GDP…..
The prompt is about Gross Domestic Spending.
Hi Tsiz Cheung, I’m not sure what errors you can see here – could you provide some more detail? The writer is using GDP because the expenditure is shown as a percentage of each country’s GDP, so that is absolutely fine to do, it’s not a mistake.