You are advised to spend a maximum of 20 minutes on this task.
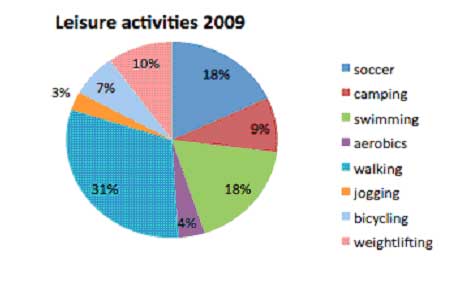
The following pie charts show the results of a survey into the most popular leisure activities in the United States of America in 1999 and 2009.
Summarise the information by selecting and reporting the main features, and make comparisons where relevant.
You should write at least 150 words.

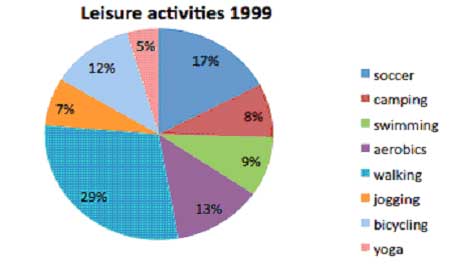
The reveal information about the most common leisure activities which the engaged in between 1999 and 2009. Overall, the largest percentage of people living in the US enjoyed walking.
As can be seen clearly, the figures for soccer, camping and walking increased slightly by to 18%, 9% and 31% respectively during the ten-year period. On the other hand, the proportions of people yoga (5 to 10 % ) and swimming ( 9 to 18% ) over the same period.
By contrast, the witnessed a significant decrease in the percentages of American people participating in the remaining activities. To be more specific, the figure for jogging nearly halved from 7% to 3%. What is more, there was a dramatic fall in the proportion of aerobics players . Finally, when it comes to bicycling, the figure for this activity dropped from 14% to 7%.
The candidate has interpreted the pie charts fairly well. This report is easy to read. The main features are compared and contrasted well with relevant figures. There are some minor inaccuracies, but they do not interfere with the reading of the report. Overall, the task response is good. Suggested improvements: pay a little more attention to the grammatical range and accuracy. Overall, this report seems worthy of Band 7
Click here to see more IELTS reports of band 7
Pingback: IELTS Sample Reports of Band 7 | IELTS-Blog
The actual figure for bicycling in 1999 was 12%, not 14%. I tend to make this kind of mistakes, and does these careless mistake cause serious decrease to grading?
You’re right, Taizo! That figure should be 12%, not 14%, well done for noticing that. In the real exam such error would affect your Task Achievement score, which equals 25% of your total Task 1 score. As you know, Task 1 is assessed using 4 equally weighted criteria: Task Achievement, Coherence and Cohesion, Lexical Resource, and Grammatical Range and Accuracy. Since Task Achievement is just a quarter of the total score, there would be a reduction in your score, but it wouldn’t be devastating.