This report was written on a topic from “Target Band 7” book (page 40, reprinted with permission).
You should spend about 20 minutes on this task
The line graph below describes rainfall statistics for Somecountry.
Write a report for a university lecturer describing the information shown.
Write at least 150 words

Answer (approx. IELTS Band 7 level)
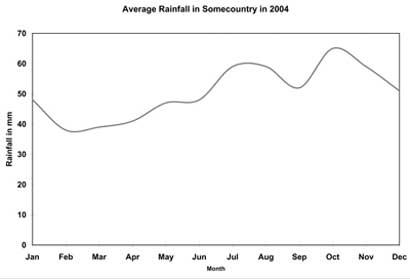
The line graph compares the average of amount of rainfall in Somecountry in 2004 in monthly terms. It can be clearly seen that the rainfall was the lowest in February, but relatively high in July, August and October.
From January to May 2004 the monthly amount of rainfall was below 50mm, and the least amount of rainfall was reported in February. The figures from March to May were gradually rising, however there were no significant changes during that period.
In contrast, between June and December the rainfall was quite volatile. For instance, while July and October had the higher amount of rainfall, 60mm and 65mm respectively, September saw a rapid decline in precipitation, dropping to 55mm. The rainfall in December also declined from October’s high to just about 50mm.
In conclusion, we can say that earlier months saw stable amounts of rainfall, but in the second half of the year the rainfall constantly fluctuated.
Click here to see more IELTS reports of band 7