Skip to content

IELTS Reports- Band 8

IELTS Writing – samples of IELTS reports of Band 8

IELTS report, topic: Shopping centre map comparison

You should spend about 20 minutes on this task

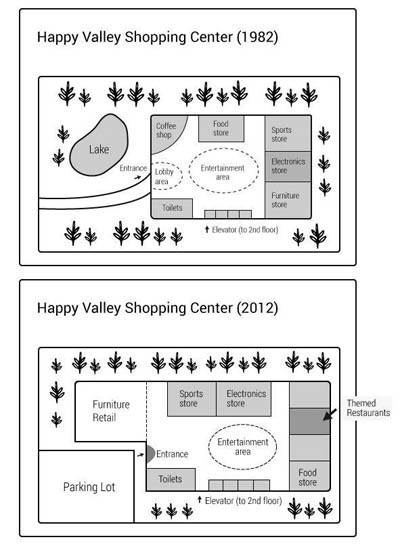
The maps below show the Happy Valley Shopping Center in 1982 and 2012. Summarise the information by selecting and reporting the main features, and make comparisons where relevant.

Write at least 150 words

Happy Valley Shopping Center in 1982 and 2012

Band 8 Answer

The two maps show the radical changes that Happy Valley Shopping Center underwent during the period between 1982 and 2012. Overall, it is clear that the redevelopment resulted in expansion of the shopping mall and rearrangement of its in-house facilities.

By 2012, the indoor shopping area spread to the west, and the outdoor lake was replaced by a furniture retailer. Additionally, considerable changes were made to the north-west part where a coffee shop was removed and an adjacent food store was relocated to the south-east corner of the mall. Two stores selling sports and electronic goods took over their previous locations along the northern wall. A linear array of themed restaurants moved in along the eastern wall of the shopping centre, replacing sports and electronics shops. On the western side, the lobby area at the main entrance was removed to allow for a bigger central entertainment area.

Yet another alteration was made outside, where a path leading to the main entrance of the mall was removed and instead a spacious car park was built. The entrance, however, was kept in the same location and the lines of trees surrounding the shopping centre remained largely unchanged where possible.

Teacher’s comment: This is a great report. All aspects were covered and a well-developed response was provided. The writer’s vocabulary could have been richer and word choice needs a bit more attention. Overall, seems worthy of Band 8.

Click here to see more IELTS reports of band 8

IELTS report, topic: Bar chart and pie chart describing residential water consumption (from IELTS High Scorer’s Choice series, Academic Set 1)

This report was written by a student on a topic from IELTS High Scorer’s Choice series, Academic Set 1 book (page 97, reprinted with permission).

You should spend about 20 minutes on this task

The bar chart below shows the average Australian water consumption in selected cities for last year. The pie chart shows the distribution of Australian water consumption for last year.

Summarise the information by selecting and reporting the main features, and make comparisons where relevant.

Write at least 150 words

Bar chart and Pie chart describing residential water consumption (from IELTS High Scorer's Choice series, Academic Set 1 book)

Answer

The bar chart illustrates the average Australian water use in 6 selected cities for last year, while the pie chart describes the share of water each industry consumed in 2014.

Overall, Perth had the highest average water use for last year with 300 kilolitres per property, followed by Adelaide and Brisbane with 240 and 250 kilolitres property respectively. On the other hand, Melbourne and Canberra showed the lowest average water consumption of 150 and 140 kilolitres respectively.

Taking a look at the distribution of water use by industries, we can clearly see that Agriculture took over two thirds of the entire consumption , followed by households . Water Supply, Sewage and Drainage industry consumed the same amount of water as the Electricity sector, 7%. In the same way there was no difference between the consumption of Manufacturing and Other industries, with both sectors using 4% of the national water supply. The smallest user was the Mining industry, accounting for just 2% of Australian water use.

To conclude, the city of Perth and the Agriculture industry had a major impact on the usage of Australian water.

The information on two charts was covered in this well-developed response. The data was grouped correctly and a wide range of vocabulary and sentence structures was used. The minor grammatical mistakes (mouse over words underlined in blue shows the corrections) could have been caught at the final proofreading stage. Overall, this report seems worthy of Band 8.

Click here to see more IELTS reports of band 8

the right preposition to use here is “per”, not “of”
the preposition “at” is missing here – “at 67%”
the preposition “at” is missing here – “at 9%”