Skip to content

IELTS Reports- Band 8

IELTS Writing – samples of IELTS reports of Band 8

IELTS Report, topic: Table describing the viewers’ preferences for TV programs

This is a model answer for an Academic Writing Task 1 from the IELTS exam in Canada, shared recently. This response is likely to get Band 8 or 8.5 in IELTS.

You should spend about 20 minutes on this task

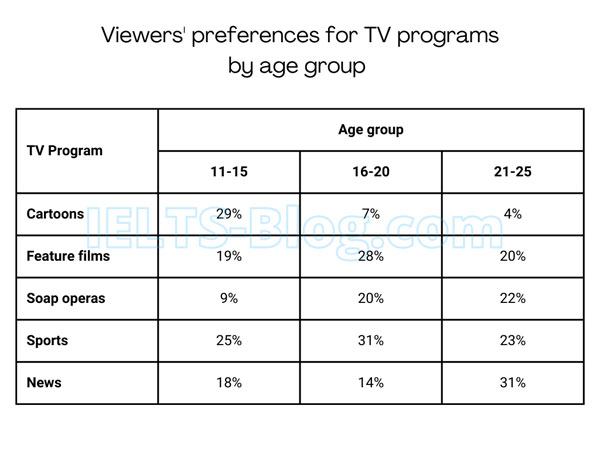
The table below shows the results of a survey conducted in 2012 in a European country, where viewers were asked about their preferences for TV programs. Summarise the information by selecting and reporting the main features, and make comparisons where relevant.

Write at least 150 words

IELTS Writing Task 1 Table of TV Program Viewer Preferences
* Note: this isn’t the actual table given in the test, it was recreated for the purpose of demonstration.

Band 8.5 Model Answer

The table summarises 2012 survey results about the favourite TV programs of people living in a European country, and the data is categorised by three different age groups, namely 11-15 years old, 16-20 years old and 21-25 years old.

Overall, it can be clearly seen that people in the oldest age groups preferred to watch either sports or the news and had the least interest in cartoons. The youngest age group, on contrary, was mostly interested in cartoons.

Looking at the table in greater detail, we can see that 29% of 11 to 15 year-olds enjoyed watching cartoons, which is more than any other age group, while the older viewers (16 to 20 and 21 to 25 year olds) were far less likely to watch such programs, at only 7% and 4% respectively.

The category of Feature films appealed to all the three age groups; 19% of the youngest viewers, 28% of the 16-20 year olds, and 20% of the oldest age group liked watching films. Sports programs have also been watched by a large proportion of viewers from all the three age groups, with the ratios ranging from 23% to 31%.

Only a small proportion of people from the youngest group watched Soap operas, just 9%, while an average of 20% of people from the other two groups watched this type of show.

Click here to see more IELTS reports of band 8

IELTS Report, topic: Bar charts describing the hours worked by men and women in 3 countries

This is a model answer for an Academic Writing Task 1 from the IELTS exam in the USA, shared recently. This response is likely to get Band 8 or 8.5 in IELTS.

You should spend about 20 minutes on this task

The charts below show the average hours worked last year by full time and part time employees in 3 countries. Summarise the information by selecting and reporting the main features, and make comparisons where relevant.

Write at least 150 words

IELTS Writing Task 1 Bar Charts of Hours Worked By Men and Women in 3 Countries

Band 8.5 Model Answer

The bar charts show the average number of hours that full-time and part-time employees worked in the Netherlands, the UK and Greece in the previous year.

Overall, what immediately stands out is the fact that the number of hours worked by male and female workers was relatively equal for both types of work, and that full-time employees worked almost twice as much as part-time employees.

Taking a closer look at the numbers for full-time positions, the figures for both men and women ranged between 35 to 40 hours per week. Male workers in the UK were the only ones to exceed 40 hours a week. The figures for the Netherlands were the lowest for both genders, at around 35 hours weekly.

Moving on to part-time employment, the difference between the number of hours worked by men and women is more apparent in this chart. People from the Netherlands worked the fewest hours with men spending 10 hours, and women – roughly 15 hours per week at work. The UK had almost equal figures for both genders, around 17 hours a week, while the figures for Greece were slightly higher; the male workers there did around 20 hours per week and female – a touch above 20.

Click here to see more IELTS reports of band 8