Skip to content

IELTS Reports- Band 8

IELTS Writing – samples of IELTS reports of Band 8

IELTS Report, topic: Comparing current and future floor plans of a museum (from Target Band 7 book)

This report was written on a topic from “Target Band 7” book (page 46, reprinted with permission).

You should spend about 20 minutes on this task

The diagrams below show the current ground floor plan of a museum and the proposed changes to its layout. Summarize the information by selecting and reporting the main features and make comparisons where relevant.

You should write at least 150 words

Current ground floor plan of a museum, writing task 1  from Target Band 7 book
Future ground floor plan of a museum, writing task 1  from Target Band 7 book

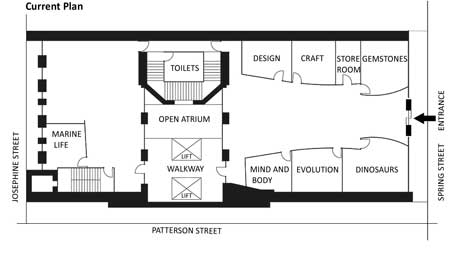
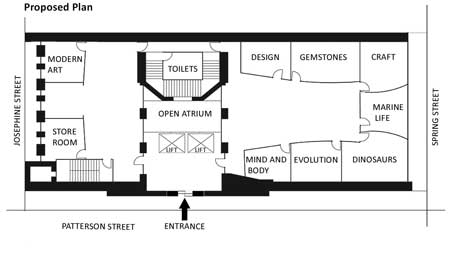
The two diagrams describe the current ground floor plan of a museum and its future modification. The most noticeable change is that a special area will be added for the Modern Art exhibition.

Looking at the diagrams we can see that the entrance to the museum will be relocated from Spring street in the eastern side of the building to the southern side of the building, in Patterson street. This change will make the location of the lifts more convenient, exactly opposite to the entrance, unlike the current lifts situated further away from the entrance.

The Gemstones exhibition will remain almost in the same place, but the area allocated to it will be enlarged and shifted to the centre. Essentially, it is swapping places with the Craft exhibition, which is being pushed to the corner. Another significant change is the intended relocation of storeroom to where Marine Life is currently situated and making it more spacious. A new location has been proposed for Marine Life near the former entrance to museum.

Overall, the highlight of the proposed plan of the museum’s ground floor is the launch of Modern Art exhibition. The rest of the museum halls, toilets and the open atrium area will remain largely unchanged.

Click here to see more IELTS reports of band 8

IELTS Report, topic: Pie chart and bar graph describing employment percentages (from Target Band 7 book)

This report was written on a topic from “Target Band 7” book (page 43, reprinted with permission).

You should spend about 20 minutes on this task

The diagrams below contain information regarding percentages of people occupied in various types of position in 1998 and 2001.

Write a report for a university tutor describing the information shown.

Write at least 150 words

Pie chart describing percentages of workers in different positions from Target Band 7 book
Bar graph describing percentages of workers in different positions from Target Band 7 book

The two charts describe the number of people in various types of employment (casual, unemployed, full time job, part-time job, self-employed and contract) in 1998 and 2001. It is clear that the majority of people held a full time position in both 1998 and 2001.

In 1998 full time workers were the largest group (at 37%), followed by people working part-time jobs (27%), self-employed (19%) and contract workers (12%). Casual labourers and the unemployed made up only 3% and 2% of the workforce, respectively.

In 2001, although full time position holders were still the majority, their proportion dropped to 28% and that of part-time workers – to 20%. The proportion of self-employed remained at 19%, but the number of contract workers’ noticeably increased to 18%. Another significant increase was in the proportion of unemployed, which grew more than threefold to 7% in 2001. Casual workers’ share seemed to stay unchanged at 3%, making them the smallest group in the workforce.

Overall, the charts demonstrate a trend of people leaving full-time employment and the growing unemployment.

Click here to see more IELTS reports of band 8