You should spend about 20 minutes on this task.
The table below shows the proportion of different categories of families living in poverty in Australia in 1999.
Summarise the information by selecting and reporting the main features, and make comparisons where relevant.
Write at least 150 words.

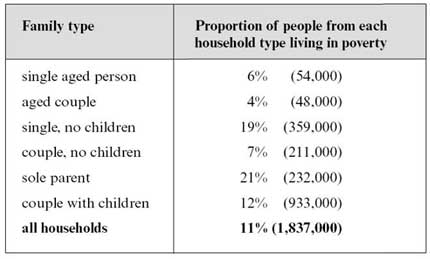
The table shows a breakdown of different types of families who were living in poverty in Australia in 1999.
It is noticeable that 11% of people were living in poverty. However, this figure was considerably high among the sole parents and single people who did not have children and percentages were 21% and 19% respectively. Moreover, this proportion was significantly prominent among the couples who had children compared with couples who did not have children. In fact, the proportion of couples with children living in poverty was 5% than that in the family types only couples. In contrast, this trend favoured aged people. However, this figure was slightly (2%) among the single aged people than that in the family category of aged couples.
In conclusion, it is clear that the proportion of people living in poverty varied according to their family structures.
This report covers the requirements of the task. The main trends / features were mentioned, but could have been developed more fully. The candidate has arranged ideas coherently. The range of vocabulary is sufficient, even though it lacks flexibility to some extent. There are a few grammatical mistakes in the report. Overall, the task response meets the expectations and seems good enough to achieve Band 7.
Click here to see more IELTS reports of band 7