You should spend about 20 minutes on this task.
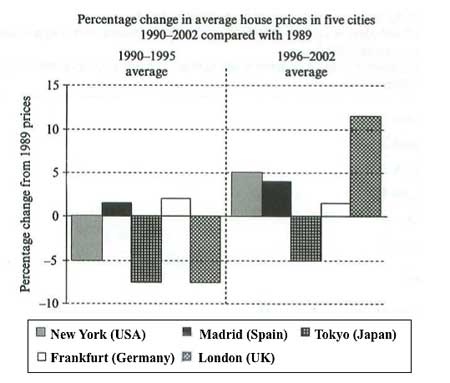
The chart below shows information about average house prices in five different cities between 1990 and 2002 compared with average house prices in 1989.
Summarise the information by selecting and reporting the main features and make comparisons where relevant.
Write at least 150 words.

The chart provides a the average house prices in five various cities from 1990 to 2002 along with a comparison with house in 1989. Overall, it is clear that the average house increased substantially over the given period compared with the prices in 1989.
As can be seen, between 1990 and 1995, the average house prices in Tokyo and London a sharp dip by approximately 7% in both cities. They were followed by New York with a 5% decline. In contrast, the average house showed a slight increase of 2% and 2.5% in Frankfurt and Madrid respectively.
On the contrary, during the period 1996 to 2002, London with 12% demonstrated a sharp growth in housing prices. It was followed by New York and Madrid with 5% and 4% respectively along with a small increase of around 2% in Frankfurt. Similarly, Tokyo showed a rise of about 2% but it was still 5% lower than the average house in 1989.
A reasonable outline of main trends, differences or states was given. The key features were presented and emphasized, but some aspects were left out of the description. There is a logical organisation of information; it is evident that the writer progresses from one idea to another. The linking words and phrases are used, however at times they are inappropriate or forced (not natural). The range of vocabulary is wide enough for the writer to show some flexibility and accuracy of expression, however repetition of the same word can clearly be seen throughout this report. There are incidental errors in word choice, spelling and word formation. Overall the control of grammar and punctuation is good, with only a few errors made. This report seems worthy of Band 7.
Click here to see more IELTS reports of band 7
Pingback: IELTS Sample Reports of Band 7 | IELTS-Blog