IELTS Report, topic: Flow chart describing how laundry service works (from Target Band 7 book)
This report was written on a topic from “Target Band 7” book (page 45, reprinted with permission).
You should spend about 20 minutes on this task
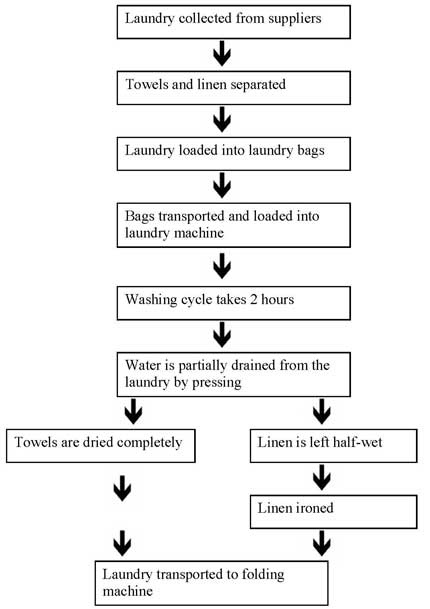
The flow chart below explains how laundry is handled.
Using information from the flow chart describe the laundry process.
Write at least 150 words

Answer (approx. IELTS Band 7 level)
The flowchart illustrates how a commercial laundry service works. There are nine or ten steps involved in handling laundry, and the number of steps depends on the type of laundry.
After laundry is collected from suppliers, it is separated into towels and linen. Each type of laundry is loaded into laundry bags, which are then transported and loaded into a laundry machine. Following that, the washing cycle begins, and it takes two hours from start to finish. After washing, water is partially drained from the laundry by pressing, and the next stage is different for towels and linen. Towels are dried completely, whereas linen is only partially dried. The half-wet linen is then ironed. In the final step, laundry, including both towels and linen, is transported to the folding machine.
Overall, the entire process is very similar for the two types of laundry. The only step that differs relates to the level of dryness of the laundered fabric.
Click here to see more IELTS reports of band 7