These questions were shared by H who recently took the IELTS test in India:
Speaking test
Interview
– What is your full name?
– What should I call you?
– Where are you from?
– Where is your town located in the country?
– What are the special features of your hometown?
– Would you like to stay there in the future? Why?
– What is the weather like in your country?
– How many different seasons are there?
– Do you prefer a cold or a hot season? Why?
Cue Card
Describe a film based on a real life event or a real person. Please say
– When did you see it?
– Did you like it or not? Why?
– What did you learn from the movie?
Discussion
– In your country what kind of real people are filmed in movies?
– What do you think is better: to read a book or to see a movie based on a book?
– What are the most important things to make a movie successful?
– Do you think the star acting in the movie influences the success of the movie? Why?
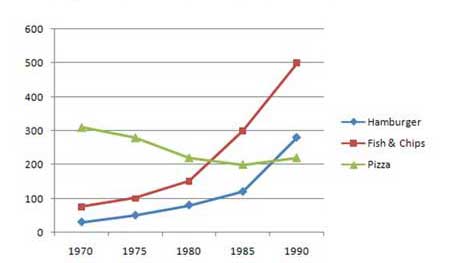
The chart below shows the amount of money per week spent on fast foods in Britain. The graph shows trends in consumption of fast foods. Write a report for a university lecturer describing the information shown below.
Summarise the information by selecting and reporting the main features and make comparisons where relevant.
Write at least 150 words.
The bar chart illustrates the expenditure on three different types of fast food hamburgers, fish and chips and pizza in different .
From the chart, it is clear that in a high-income group, 40 pence is spent on hamburgers a week, which is the largest among the expenditures on all the three types of fast food. This expenditure is also the greatest one in the average income group, but the amount of money spent is only about 33 pence a week, less than that in the high-income group. As for the low-income group, the largest expenditure is on fish and chips, about 18 pence a week.
The line graph compares the trends of the amount of three of fast food consumed between 1970 and 1990. It is clear that the amount of hamburgers and fish and chips consumed showed an increasing trend, while pizza gradually decreased from 300g in 1970 to in 1985, before it grew to about 240g in 1990. The consumption of fish and chips overtook that of pizza and hamburgers in 1982 and 1988 respectively.
This report covers the requirements of the task. The main trends and features were presented but should be developed better. The candidate has arranged ideas coherently, though the data is reported in a repetitive way. The range of vocabulary is adequate. There are a few errors in grammar and word choice, and one instance of inaccurate data (mouse over the underlined words shows corrections). Overall, this task response meets the expectations and seems good enough to achieve Band 7.